
Enterprise Architecture
One company, five descriptions.
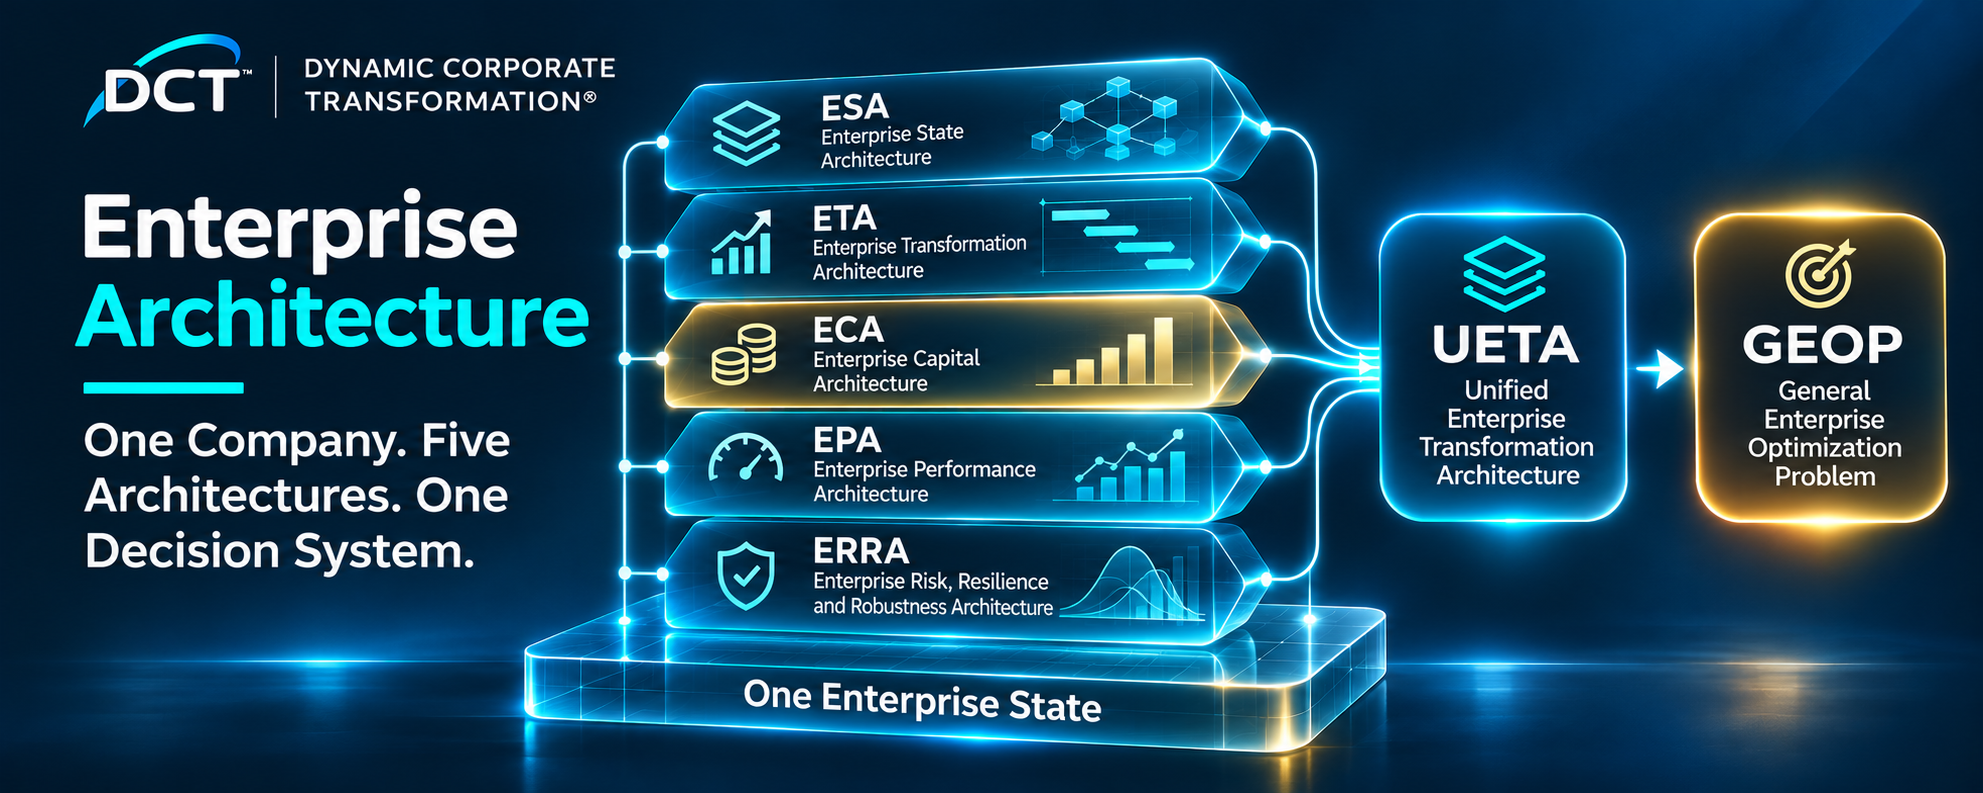
DCT describes a company in five ways: its wiring, its moves, its capital, its performance and its exposure. Then it insists that the five describe one company. The architectures stand on one skeleton and read one state, a register records what passes between them, and the decision problem sits on top of all five.
Overview
A note on the word “architecture”
In IT practice, enterprise architecture usually means the business, data, application and technology architectures of frameworks such as TOGAF, or the views of the Zachman framework. DCT Helix uses those layers to decide which shared programmes exist, and then decides when each one is laid and which departments it serves first.
DCT’s five architectures answer a different question: how the company itself is wired, moved, funded, measured and exposed while it changes. The practitioner frameworks supply a vocabulary of views and descriptions; DCT makes the description a mathematical object with theorems.
The architectures, one tab each
1ESAVol I, Ch 9
Enterprise State ArchitectureAS
What depends on what?
The org chart says who reports to whom; the wiring says whose results move whose. A shock travels only along the wiring, and no faster than the number of links it must cross. Loops gather in a tightly coupled core, and a limit that binds units in a loop cannot be signed off unit by unit: it has to be reviewed jointly.
2ETAVol I, Chs 6–8
Enterprise Transformation ArchitectureAT
What can be done, and in what order?
Every initiative has preconditions, and outside them it cannot be taken at all. A target can be reached only along some sequence of moves, so order is a matter of feasibility, not of taste. A playbook can be repeated only if each round restores the preconditions of the next.
3ECAVol I, Ch 10
Enterprise Capital ArchitectureAC
What does the company have?
Most of what makes change possible (skills, platforms, routines, relationships, position) is not on the balance sheet. Every stock has a rent, the investment needed merely to hold it, and a speed limit on how fast it can be rebuilt. Capital is fast to destroy and slow to rebuild.
4EPAVol I, Ch 11
Enterprise Performance ArchitectureAP
What does it deliver?
Between options that do not dominate each other, a weighted scorecard does not discover the winner: its weights choose it, and its scaling is a second set of weights. A programme that builds the company’s state is measured as underperformance first, because its costs arrive at once and its benefits later. Declaring the apparatus turns a verdict into a choice the board owns.
5ERRAVol I, Ch 12
Risk, Resilience and RobustnessAR
What can it lose, absorb and recover from?
Boards use one word for four questions, and each needs its own number: how likely and how bad a loss is (risk), where a shock hurts (vulnerability), how large a shock the company can take before it breaks (robustness), and how far it can be pushed and how fast it springs back (resilience).
6UETAVol I, Chs 13–14
Unified Enterprise Transformation ArchitectureUE
Do the five descriptions make one company?
One state, five ledgers, and one register of the couplings between them. Unifying costs the existing models nothing, since each survives unchanged, but it adds what no single ledger can see: a whole that is unstable while every layer passes its own test, cash promised twice, and a single synergy that pushes the company past its stability edge.
7GEOPVol I, Ch 15
GEOP and the Enterprise Optimization Architecture
What is the best plan the architectures allow?
The architectures supply every part of one decision problem, the General Enterprise Optimization Problem: the moves, the stocks, the objective, the limits, and the couplings that bind them. Feasibility is checked before optimality, and at the optimum every limit that binds has a price.
ESAVol I, Ch 9AS
Enterprise State Architecture (ESA)
What depends on what?
What it is
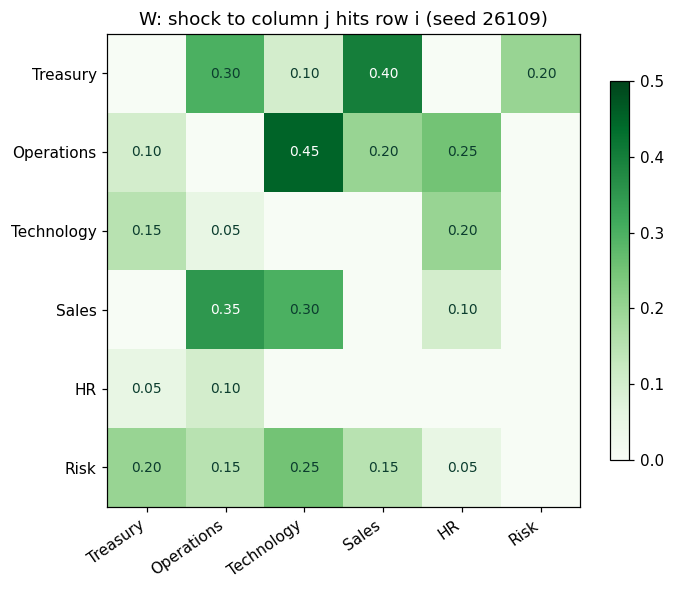
The Enterprise State Architecture describes the company as wiring rather than as an organization chart (Vol I, Ch 9, Def 9.1). It has three parts. The components are the units that carry a state of their own: divisions, shared functions, treasury, and also the market the company faces and the governance that sets its policy. The arrows say whose results move whose, and each arrow has a type. The constraints are the limits the company must respect, and each one has a scope: the components it binds.
An arrow is a dependency that can be tested; a missing arrow is a claim as well, that one unit ignores another (Thm 9.1). Each component has an interface, the readings it lets the others see, and an arrow is sound only when the reading it carries is on its source's interface (Def 9.2). The book separates four kinds of dependency: dynamic, resource flow (cash, people and materials, which are conserved), informational (signals and policy) and constraint coupling (Def 9.3, Table 9.2).
A constraint whose scope is a single component is local, and its owner can sign it off. A constraint that binds several components couples them, and the constraint graph joins any two components that share one (Def 9.7). Complexity is read from a panel of measures (size, density, cycles, feedback mass, depth), each with what it cannot see, never from one score (Def 9.10, Table 9.5).
The board questions it answers
- How soon could a demand shock reach the loan covenant?
- Can a given shock reach a given unit at all, and what would it take to insulate it?
- Where are the self-reinforcing loops, and do they match the org chart?
- Can we trust the two-box summary map the board looks at?
- Which limits must be reviewed jointly, rather than unit by unit?
- Can our model answer the question we are putting to it?
What the book proves
- Thm 9.1 The canonical wiring is minimal and sufficient; a missing arrow is a claim of independence.
- Thm 9.2 A shock moves no faster than the links it crosses. It travels only along the arrows, so the number of links between two units is a floor on arrival time, never a forecast.
- Thm 9.2(iii), Prop 9.3 Feedback lives in cores. Outside them the company falls into a one-way order of layers, from the drivers to the core.
- Thm 9.3 A summary map can be trusted one way only. Rolling units up never hides a real route, but it can invent one that does not exist.
- Thm 9.4 Cycles defeat bilateral checks. Where the constraint graph has a cycle, every pair can sign off while the joint limit fails; on a tree, bilateral sign-off is safe. Each cycle needs one joint review.
- Thm 9.5 Completeness is a coverage check: the architecture can answer a question only if the readings that question needs are in it, and every aggregation spends some of that coverage.
Meridian, the book’s worked company
Meridian, the book's worked company, is wired as Vol I, Worked Example 9.1 sets out.
- Seven components: three divisions (Industrial Systems, Digital, Materials), shared engineering, treasury, the market and governance. Fourteen typed arrows: demand from the market to each division, cash from each division to treasury, funding from treasury to Industrial Systems and Digital (Materials funds itself), capability both ways between engineering and the two divisions it serves, and policy from governance to treasury and to Digital. (Vol I, WE 9.1; Fig 9.1)
- The feedback core is Industrial Systems, Digital, engineering and treasury, with six directed loops. The market and governance drive it; Materials feeds it. The condensation has depth 2. (Vol I, WE 9.1 Step 2; OA 9.B.Ex.7)
- A demand shock reaches the three divisions in one quarter and treasury, where the covenant sits, in two; governance is never reached. Five distinct paths run from the market to treasury, and the minimum cut is 3 arrows, for example the three cash arrows. (Vol I, Table 9.7; WE 9.1 Step 3)
- The complexity panel: 7 components, 14 arrows, density 0.333, cycle measure 8. (Vol I, §9.8; OA 9.B.Ex.7)
- The constraint graph is a triangle of the three divisions under the strategic-risk ceiling of 75, plus a branch between engineering and Digital for the capability floor of 55: exactly one joint review, then one bilateral check. The review matters: strategic risk peaks at 73.6 around month 11, inside the ±6 measurement error of the ceiling. (Vol I, WE 9.1 Step 4; OA 9.B.Prop.6)
- The board's reading: the covenant has a one-quarter reaction window along three separate routes, so headroom, not insulation, is the defence. (Vol I, WE 9.1)
Explore it
- Meridian's wiring. Seven components and fourteen typed arrows (Vol I, WE 9.1, Fig 9.1), in their causal layers: drivers, feeder and the feedback core, whose four components are outlined. Select a component or an arrow, on the drawing or in the list below it, to read what it is, its role and Meridian's reading.
How it goes wrong
- The org chart is taken for the wiring, and a shock arrives by a route nobody drew.
- Every unit signs off its own share of a limit that binds a loop; each bilateral check passes, and the joint limit is breached (Thm 9.4).
- A summary map shows a connection that exists only on the map (Thm 9.3). On Meridian's two-box map the centre appears to reach Materials, which no arrow does (Fig 9.2).
- An arrow is drawn with no reading behind it, or a unit relies on a reading its source never exposes: an interface gap (Def 9.8).
- A question is put to a model that lacks the readings to answer it: Meridian's can bound when a shock reaches the covenant, not whose orders fall first (§9.7).
What a company must declare
- Components: code, name, kind (division, shared function, treasury, market, governance), owner, the readings each holds and the readings it exposes.
- Arrows: from, to, type, the reading each carries, and a witness: a situation in which the dependency is active.
- Constraints: the statement, its reading, sense and level, its scope (the components it binds), its class, who can change it (board, lenders, regulator) and its owner.
- The hierarchy: what each component rolls up to.
- Where useful, the questions the architecture must answer and the readings each one needs.
How AXIOM uses it
AXIOM's architecture module (in development) takes components, typed arrows and scoped constraints as a declaration and is being built to read arrival floors, feedback cores, minimum cuts and the joint reviews they imply from that declaration, so the wiring behind every other number can be inspected.
Best Practices
Practices from the Corporate Transformation Best Practices knowledgebase that bear on this architecture.
- Map critical dependencies several tiers deep, buffer what cannot be re-sourced, and decide who pays for resilience
Drawing the dependencies before a shock is the wiring diagram's whole purpose: a route that is not drawn cannot be defended.
- Build the enabling architecture and infrastructure before the applications that depend on it
An order of work that follows the arrows: what others read must exist before they can read it.
- Measure and report each business separately before deciding its future
A component is defined by its own state and readings; a consolidated view hides which unit moves which.
- Make bad news safe and fast to reach the top, and act on it
An informational arrow is only real if the reading actually travels along it.
- Reorganise around the new business and the units that face customers, before the transition, not after
Where the reporting lines and the working dependencies differ, this practice moves the org chart towards the wiring.
Cases
- Toyota Motor Corporation: Supply-chain resilience after the 2011 Great East Japan Earthquake (2011 onward)
The knowledgebase cites this case as evidence for BP-064.
Further reading
Read it on the DCT MapIn the LexiconRead the chapter: Vol I, Ch 9
ETAVol I, Chs 6–8AT
Enterprise Transformation Architecture (ETA)
What can be done, and in what order?
What it is
The Enterprise Transformation Architecture is the repertoire of moves the company can make (Vol I, Chs 6–8; named in Table 1.4). Each move is an operator: a declared action that takes the company from one state to another (Def 6.1). Its declaration records what it does, the resources it consumes, the part of the company it touches and where its effect comes from, whether fitted to data, engineered or assumed.
Every operator has a domain, the set of states from which it can be taken (Defs 6.2–6.4). Outside the domain there is no result at all: readiness stops meaning "should not" and starts meaning "cannot". Operators compose into programmes, so a programme is a word written in the repertoire (Defs 6.5–6.7), and the states that some word of length k can reach form the k-step reachable set (Def 6.9).
The repertoire runs on a clock. Chapter 7 adds the state equation, with the decisions the company makes, the environment it does not control and the feedback that links them; Chapter 8 adds uncertainty, so every plan carries a fan of outcomes and some events arrive as jumps. In the unified view each operator also carries a write set, the components it changes, so a move is booked in every ledger it touches (Def 13.6).
The board questions it answers
- Can we take this action from where we are today?
- Is the target reachable, and by which shortest sequence of moves?
- Is this playbook a strategy we can repeat, or a trade that runs out?
- How far will execution drift from the design?
- What are the odds the plan breaches a floor on the way?
- How hard should we steer a loop that answers with a delay?
What the book proves
- Thm 6.1 An operator and a step of the company's dynamics are one subject. An effect that needs the environment's cooperation is an assumption, not a commitment.
- Thm 6.4 A target is reachable exactly when some sequence of moves gets there, and a breadth-first search of the planning tree finds the shortest one. Some targets can be approached but never reached, and must carry a tolerance.
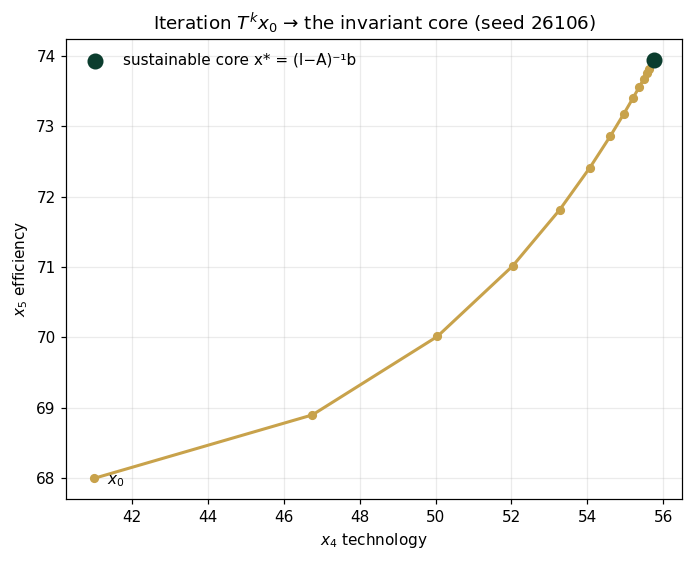
- Thm 6.3 The sustainable core is the largest set from which a move can be repeated for ever. A playbook is a strategy only from inside it; outside, it is a trade that runs out.
- Thm 6.5 Execution error compounds when a programme amplifies it and stays bounded when the programme damps it, so the same shortfall can be harmless or ruinous.
- Thm 7.5 A loop that answers with a delay tolerates far less steering: pushing harder can make it cycle instead of converge.
- Thm 8.5(ii) The flaw of averages: the plan run on average inputs is not the average outcome of the plan.
Meridian, the book’s worked company
Meridian's repertoire is four moves: an automation round, a digital build, and the sale of part of Industrial Systems with or without its engineers.
- The automation round costs $120m, closes half the gap to an efficiency ceiling of 85 and adds one capability point. It can be taken only with liquidity of at least $470m and workforce capability of at least 55. (Vol I, WE 6.1; Fig 6.1)
- From today ($620m of liquidity, technology 41, capability 58), three of the four first moves are possible: the digital build alone would leave $310m, below the board's $350m floor. Selling with the engineers leaving drops capability to 53 and is a dead end, since neither the build nor automation can follow. The target, technology of at least 50, is reached by exactly one path: sell while keeping the engineers, then build, ending at $356m, $6m above the floor. (Vol I, Fig 6.3; Thm 6.4)
- With its savings paid out, the automation playbook fails in the third round. With savings recycled, efficiency climbs 71, 78, 81.5, 83.25 and on towards the ceiling, and the round can be repeated from any liquidity of at least $535m, so Meridian has $85m to spare. (Vol I, WE 6.1; Table 6.4)
- The plan's liquidity trough is $482m at quarter 7, but once quarterly deviations and funding-window closures are added the chance of breaching the floor is 24.6%. A $100m standby line alone brings it to 12.4%, a phased build alone to 13.1%, and both together to 3.0%. (Vol I, WE 8.1; Table 8.5)
- Meridian's hiring loop is stable for steering gains below 3.17; with a one-quarter delay the limit falls to 1.67, and the cautious gain of 0.5 turns out to be the fastest. (Vol I, WE 7.1; Table 7.5)
Explore it
- The repertoire and the planning tree. Meridian's four moves and every sequence of up to two of them from today (Vol I, Fig 6.3). Numbers are liquidity, technology (T) and workforce capability (W). Select a move in the repertoire to read its preconditions and effects, or a branch to see why it is open or pruned.
How it goes wrong
- An initiative is approved whose preconditions do not hold today. It has no result, however strong its business case.
- A target is set that no sequence of moves reaches, or that the only path reaches with no margin: Meridian's single route ends $6m above its floor.
- A playbook is run that consumes its own precondition, and it stops in the third round.
- A plan is judged on its average path. Meridian's planned low is $482m; the mean of its simulated lows is $384m (Thm 13.4(iv)).
- An effect that depends on the market cooperating is booked as a commitment (Thm 6.1).
What a company must declare
- The state readings: each with its unit, measurement source, error band, today's value, the ledger it belongs to and the component that carries it.
- For each initiative: its effect on each reading, its preconditions (reading, sense and level), its write set and the provenance of its effect.
- Where execution drift matters, each move's sensitivity and its expected shortfall.
- The stochastic channels: the size and persistence of deviations, and the rate and severity of discrete events.
How AXIOM uses it
AXIOM computes the odds that a plan breaches a floor on the book's model (it reproduces Meridian's 24.6%) and the steering regimes of a delayed loop. Operator domains, the planning tree and the sustainable core belong to AXIOM's architecture module (in development).
Best Practices
Practices from the Corporate Transformation Best Practices knowledgebase that bear on this architecture.
- Gate every go-live on measured readiness, not on the calendar
A go-live check is an operator's domain made explicit: the move is taken only from states that meet its preconditions.
- In distress, stabilise cash and cost first, repair the core next, and invest for growth only then
An order of moves in which each one creates the preconditions of the next, as on Meridian's planning tree.
- Roll out operational and system change in waves, each proven before the next
A wave is a repeated move; proving each one first is checking that the round leaves the next one possible.
- Simplify what you sell and the rules you run before you automate or scale them
Sequencing as feasibility: one move enlarges the domain of the move that follows.
- Fix the core product and operation before amplifying the channel or scaling the new strategy
Amplifying a weak core compounds execution error; repairing it first keeps drift bounded.
- Limit how many things change at once, for the business and for the customer
Separate moves keep each effect readable, so drift can be seen and corrected.
Cases
- The LEGO Group: Turnaround 2004-2009 ('Shared Vision' plan)
The knowledgebase cites this case as evidence for BP-005.
Further reading
Read it on the DCT MapIn the LexiconTransformation operator, in the LexiconRead the chapter: Vol I, Chs 6–8
ECAVol I, Ch 10AC
Enterprise Capital Architecture (ECA)
What does the company have?
What it is
The Enterprise Capital Architecture is everything the company has that makes change possible, held as stocks (Vol I, Ch 10). A capital stock is a state reading that is never negative, lasts, is built by investment, wears away and produces something (Def 10.1). The book lists ten forms: financial, human, intellectual, technological, organizational, relational, strategic, governance, innovation and informational capital (Table 10.1). Only the first sits wholly on the balance sheet. The list is a modelling choice, and every entry is a measurement with an error bar.
The architecture has three parts (Def 10.2). Each form has carriers, the components that hold it: financial capital at treasury, human capital in people and functions, organizational capital in the wiring itself. Forms convert into one another along declared channels, each with an efficiency of at most one, and some forms are complements that produce only together. Governance allocates investment and sets the floors and ratios, under the same scoped-constraint discipline as the state architecture.
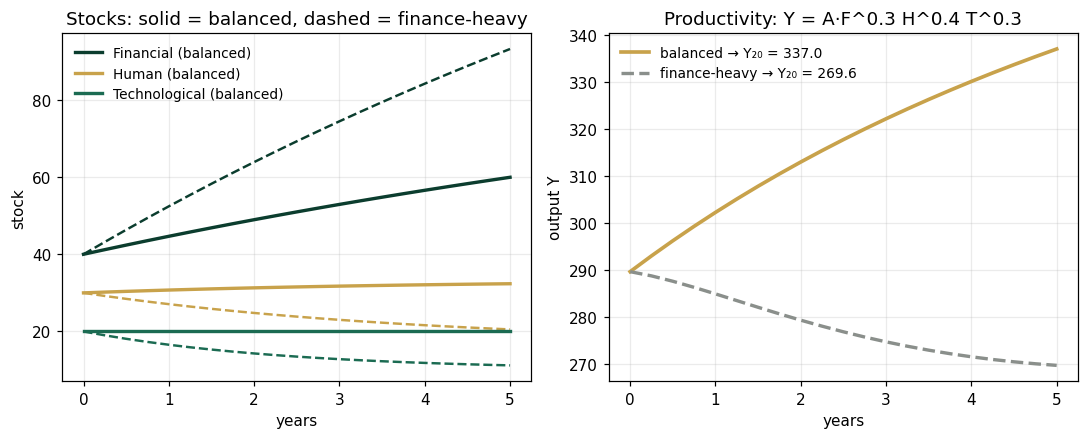
Every stock obeys one balance: next period's stock is this period's, less decay, plus investment, less use, plus what converts in, less what converts out (Thm 10.1). The forms differ on four properties: decay rate, build time, tradability and separability (Table 10.2). Financial capital barely decays and can be bought outright; human capital typically decays at 10–25% a year and can be bought only at the margin, by hiring; organizational capital is the least tradable and least separable of all.
The board questions it answers
- What stocks do we hold beyond cash, and what does each cost to keep?
- How fast can we rebuild a capability we lose?
- Where should the next dollar go: to a bottleneck, or to stocks that only work together?
- Is a programme "funding itself" by running down a slow stock?
- Is something consuming capital through a channel nobody declared?
What the book proves
- Prop 10.1 Financial capital alone does not determine what the company can do.
- Thm 10.1(ii) Conversion never creates capital. Money into technology into capability leaks at every joint, and the total leak is the programme's conversion bill.
- Thm 10.3(ii) Capital is a rental: holding a stock costs its decay rate times its size, every period.
- Thm 10.3(iii) Time to build has a floor set by the decay rate and the investment cap. No budget beyond the cap buys it faster.
- Prop 10.4 Depletion is fast and rebuilding is limited by decay: a stock lost in a day takes quarters to restore.
- Thm 10.4 Fund the bottleneck first and fund complements together; at the best allocation every stock's marginal capacity equals the budget's shadow value.
- Thm 10.5(iii) The plug detects a missing or mismeasured channel: when a stock moves by more than its declared channels explain, something undeclared is at work.
Meridian, the book’s worked company
Vol I quantifies three of Meridian's ten forms: financial, human and technological capital.
- Liquidity $620m and net leverage 3.4× (financial capital); workforce capability 58 (human capital); technology platform 41 (technological capital). (Vol I, Table 5.2)
- The sale of part of Industrial Systems is a conversion of technological, human and relational capital into cash. Liquidity rises to $732m if the engineers leave or $712m if they are kept; technology falls from 41 to 36.9 either way; capability falls to 53 unless the team is kept. The buyer's $20m discount for keeping 5 points prices capability at $4m a point. (Vol I, WE 10.1 Step 1)
- Capability decays at 0.025 a quarter, about 10% a year, and can be rebuilt by at most 2.5 points a quarter. Holding 58 costs 1.45 points a quarter, about $23m a year. (Vol I, WE 10.1 Step 2; OA 10.B.Ex.6)
- From 53, rebuilding at the cap clears 55 in 1.7 quarters (2 in practice) and regains 58 in 4.4 (5): 53.00, 54.18, 55.32, 56.44, 57.53, 58.00. On the maintenance budget alone it would take 21 quarters to clear 55 and 64 to reach 57. (Vol I, WE 10.1 Step 3; OA 10.B.Ex.6)
- Keeping the team: proceeds $92m, rebuild cost $29.0m, net $63.0m. Letting it go: $112m, $47.6m, net $64.4m, with 2 quarters below 55 and 5 below 58. The extra $20m is the price of time, not of capability. (Vol I, Table 10.5)
- The other seven forms are not quantified for Meridian in Vol I. (Vol I, Ch 10)
Explore it
- The ten forms around the firm. The capital vector of Vol I, Table 10.1, with its carriers. The three forms whose Meridian values Vol I prints are outlined. Select a form to read its definition, how it decays and rebuilds, and what the book prints for Meridian.
- Rent and rebuild clock. Meridian's workforce capability under the book's balance, C(k+1) = (1 − δ)C(k) + I, with δ = 0.025 a quarter and the cap of 2.5 points (Vol I, Thm 10.3; WE 10.1). Move the starting level and the investment; at 53 and the cap it reproduces the book's printed path.
How it goes wrong
- A programme funds itself by skipping a stock's rent: reported earnings rise by about $23m a year while capability falls below 55 within three quarters (§11.8).
- A sale or a cut destroys in a day a stock that takes quarters to rebuild, and the moves it enabled close on closing day (Prop 10.4).
- Money is spread evenly across stocks when one of them is the bottleneck (Thm 10.4).
- Complements are funded one at a time, so neither produces (Thm 10.2).
- An undeclared channel consumes capital and appears only as an unexplained plug (Thm 10.5).
What a company must declare
- For each of the ten forms: whether it is declared as a stock and, if not, why.
- Its indicator, unit, today's level and error band, and the component that carries it.
- Its decay rate, investment cap and price per unit.
- Its floors, and the moves each floor enables.
- Investment, use and write-offs for the last four to eight periods, which feed the plug audit.
- Conversions (from, to, efficiency, time) and the capacity function: fixed requirements or declared complements.
How AXIOM uses it
AXIOM computes the best path of a declared human-capital stock with Volume II's engines, from its keep rate, build cap, price per point and floor, as for Meridian. The capital vector, rents, rebuild clocks and the plug audit belong to AXIOM's architecture module (in development).
Best Practices
Practices from the Corporate Transformation Best Practices knowledgebase that bear on this architecture.
- Secure the scarce delivery skills early, and build the pipeline in-house when the market cannot supply it
Human capital is built slowly and bought only at the margin, so its build time sets the plan's pace.
- Outsource only what does not differentiate, and keep the capability to specify, integrate and replace partners
A capability that leaves the company takes quarters to rebuild; keeping a floor of it keeps the options it enables.
- Own the technology that differentiates you, and rebuild the technology organisation before expecting speed
Technological capital produces only alongside the human and organizational capital that runs it.
- Pair cost reduction with a growth strategy, and protect the investments that define the future while cutting
Cutting the investment that holds a stock is skipping its rent: the saving is borrowed from the stock.
- Plan workforce change as a funded people programme: delayer first, share the upside, and redeploy where you can
Workforce change moves the human-capital stock directly; funding it is paying for the conversion explicitly.
Cases
- Ethiopian Airlines Group: Vision 2025: a 15-year growth plan and group operating model (2010–2025)
The knowledgebase cites this case as evidence for BP-018.
Further reading
Read it on the DCT MapIn the LexiconRead the chapter: Vol I, Ch 10
EPAVol I, Ch 11AP
Enterprise Performance Architecture (EPA)
What does it deliver?
What it is
The Enterprise Performance Architecture is what the company delivers each period, kept apart from what it has (Vol I, Ch 11). Performance is a flow, produced from the state and the period's decisions (Def 11.1); capital is a stock. The book names ten dimensions: financial, operational, strategic, human, technological, innovation, governance, environmental, resilience and sustainability performance (Def 11.3, Table 11.2).
The architecture has three parts (Def 11.2). Each dimension has supports, the components where it is produced. Measurement maps turn a dimension into indicators and metrics, and an indicator is an estimate, with an error model and a range where it is valid, not the thing it estimates (Defs 11.5–11.6). The third part is the apparatus that turns many readings into one verdict: weights, normalizations, the aggregation rule, target cascades and the governance that owns them.
The aggregation rule decides how far strength may excuse weakness (Table 11.3). A weighted average lets any strength make up for any weakness; a geometric mean allows less; the minimum allows none; a floor rule ranks on the first tier and uses the next only to break ties. Sustainable performance is performance that could continue while every stock receives its rent (Def 11.11).
The board questions it answers
- Did the data choose this option, or did the scorecard's design?
- How close are our weights to a tie, and does changing the yardstick reverse the ranking?
- How long must we wait before judging a transformation fairly?
- Are we on the frontier, and what does a point of one dimension cost in another?
- Every division improved its margin; did the group?
- Is this year's performance sustainable, or borrowed from a stock?
What the book proves
- Prop 11.1 No single financial measure is complete.
- Thm 11.1(iii) An indicator that merges levels the company would rank differently loses information before anyone games it.
- Thm 11.2 Between non-dominated options the weights decide. Normalization is a second set of weights, and the aggregation rule sets how much compensation is allowed.
- Thm 11.3(iii) A programme that builds the state traces a J-curve: its costs land at once and its gains arrive through the business, so the shortest fair review window is one period plus the dip divided by the gain.
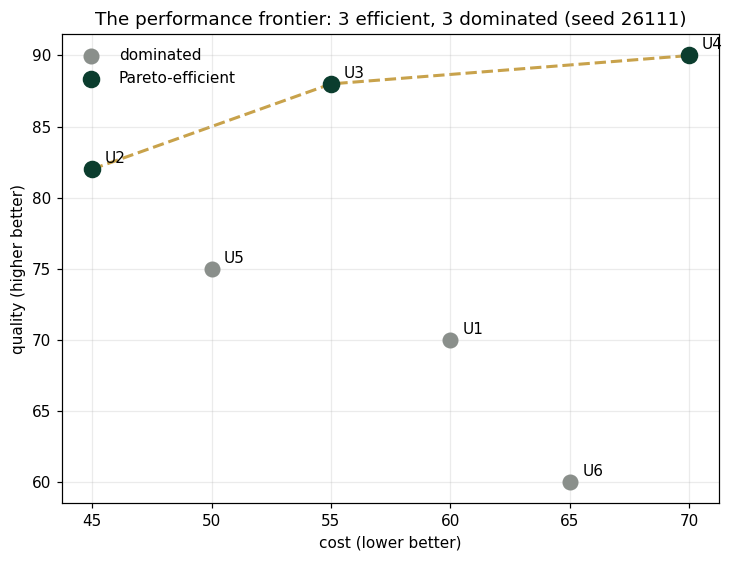
- Thm 11.4 The frontier exists and its slope is an exchange rate between dimensions; weighting reaches it but can miss balanced options that cannot be split.
- Thm 11.5 Ratios do not average: every unit can improve its margin while the group's falls, and every roll-up needs a certificate.
Meridian, the book’s worked company
Meridian's CFO scorecard is the book's running example of a performance apparatus.
- The scorecard is a quarter of (liquidity index + technology + efficiency − strategic risk); today it reads 37.0. (Vol I, WE 1.1; WE 11.1)
- At Year 5, at equal weights, the three options score 47.08 (digital build), 46.07 (restructuring) and 38.40 (turnaround). None dominates: digital leads on technology by 36.8 points, restructuring on liquidity, on risk and, narrowly, on efficiency. (Vol I, Table 1.9; OA 11.B.Ex.6)
- Each point of weight moved from technology to liquidity cuts digital's lead by 0.64, so the lead is gone after 1.6 points, at 26.6% liquidity and 23.4% technology. At 2 points, restructuring leads 47.7 to 47.5. (Vol I, WE 11.1 Step 2; Fig 11.1)
- Change only the scaling and the ranking moves: with best = 100 and worst = 0 restructuring comes first (52.3); with percentage improvement digital comes first (24.0). (Vol I, WE 11.1 Step 3; Table 11.6)
- The J-curve: digital's score falls to 32.11 at month 11 and is back above 37.0 at month 29. Annual reviews rank it last in Years 1 and 2; only a five-year window ranks it first. (Vol I, WE 11.1 Step 4; OA 11.B.Ex.6)
- Supports: financial and resilience performance at treasury, operational at Industrial Systems and Materials, strategic at the three divisions, technological at Digital, innovation at Digital and engineering. Nothing done in Digital can reach Industrial Systems' operations in under two quarters, and no path leads from Digital to Materials at all. (Vol I, Table 11.4)
Explore it
- Dimensions, readings, weights. The ten dimensions of Vol I, Table 11.2, and how Meridian's CFO scorecard turns four readings into one verdict on three options (WE 11.1). Select a node to read what it is and the book's numbers.
- Who wins depends on the weights. The Year-5 readings of Vol I, Table 1.9, scored with the CFO's formula. Move weight between technology and liquidity: at equal weights the scores are the book's 47.08, 46.07 and 38.40, and the lead changes hands where the book says it does.
How it goes wrong
- The weights decide between options that no data separates, and the verdict is presented as the data's (Thm 11.2).
- The scale is changed and the ranking reverses with no new information (Table 11.6).
- A programme is reviewed inside its dip and stopped before its gains arrive (Thm 11.3).
- Credit is claimed for an improvement the wiring cannot carry, such as Materials' efficiency for the digital programme (§11.6).
- Ratios are averaged across units, and the group looks better, or worse, than it is (Thm 11.5).
- A year's performance is borrowed from a stock by skipping its rent (Def 11.11).
What a company must declare
- For each objective and measure: the dimension it belongs to and its support components.
- Each indicator's error band, direction, normalization and reference group.
- The scorecard apparatus: weights declared by the board, the aggregation rule, any floor rules, and the review window for each programme.
- For ratio measures, the numerator and denominator by unit.
- The options to be scored, with their readings at the horizon.
How AXIOM uses it
AXIOM computes each objective's chance of reaching its target, and ranks by a stated floor rule unless the board declares weights; it never supplies weights of its own. Tie distances, normalization checks and the J-curve review window belong to AXIOM's architecture module (in development).
Best Practices
Practices from the Corporate Transformation Best Practices knowledgebase that bear on this architecture.
- Define and freeze each programme metric before reporting it, and keep it comparable
A metric's definition is part of the measurement map; changing it mid-course changes the verdict without new facts.
- Separate the programme's own effect from tailwinds, shocks and one-off gains before claiming credit
Credit must follow a route the wiring can carry; the rest is environment.
- Tie every benefit to the financial statements, bank it before counting it, and keep tracking after the programme ends
A benefit counted before it is banked judges the programme on a reading it has not yet produced.
- Design targets and incentives so that missing a target honestly is safer than meeting it falsely
Indicators estimate; a target that rewards the estimate rather than the thing is the merged-indicator problem turned into behaviour.
- Judge growth and customer strategies by unit economics and customer behaviour, not by totals or activity
Totals and ratios do not roll up honestly; unit-level readings are what a roll-up must be certified against.
Cases
- General Electric (GE): GE Digital and the Predix industrial-internet platform (2015–2018)
The knowledgebase cites this case as evidence for BP-034.
Further reading
Read it on the DCT MapIn the LexiconRead the chapter: Vol I, Ch 11
ERRAVol I, Ch 12AR
Risk, Resilience and Robustness (ERRA)
What can it lose, absorb and recover from?
What it is
The Enterprise Risk, Resilience and Robustness Architecture separates four questions that boards ask with one word (Vol I, Ch 12; Def 12.3, Table 12.1). Risk is how likely a loss is and how bad. Vulnerability is where a given shock hurts, and when. Robustness is the armor: the smallest shock that breaks a limit. Resilience is how far the company can be pushed and how fast it springs back. Each has its own object and its own number, and all four live on the state architecture.
Risk starts from loss channels, each a shortfall against a target, a floor or a covenant (Def 12.1). The book lists ten: financial, operational, strategic, technological, cyber, governance, legal and regulatory, environmental, reputational and ESG, each with its supports and a typical measure (Table 12.2). For each channel the company declares either a distribution, where odds are warranted, or a set of possible disturbances, where they are not (Def 12.2).
Robustness is a radius: the distance from today's state to the nearest wall, on a scale the company declares (Def 12.7). Resilience takes two numbers, a margin and a rate of return (Def 12.8). Propagation is carried by a gain matrix on the wiring, which says how much of a shock each arrow passes on (Def 12.11).
The board questions it answers
- How likely is a breach, and how deep would it be?
- Where would this shock hurt, and when?
- What is guaranteed, and which wall is nearest?
- How far can we be pushed, and how fast do we come back?
- What are the odds the next shock arrives before we have healed?
- Does a shock die out in the core, or echo?
What the book proves
- Thm 12.1 Expected loss and expected shortfall are coherent measures; value at risk is not, and under it a combined book can look riskier than its parts.
- Thm 12.2 The reverse stress test is the thinnest slack on the declared scale: it names the wall to watch first.
- Thm 12.3 Resilience is two numbers. Recovery is to a band, never to the point, and a sustained stress moves the equilibrium itself.
- Thm 12.4 Survival is a product of hazards, and the race between the next shock and recovery from the last has odds of 1 − e^(−λT). When armor is thin, the race is won with armor, not with speed.
- Thm 12.5 A cascade dies out only when the core's spectral radius is below one, and the multiplier says how much a shock grows on its way round.
Meridian, the book’s worked company
Meridian's readings on the four questions are set side by side in Vol I, Table 12.1.
- Risk: a 24.6% chance that the digital programme breaches the liquidity floor. Vulnerability: a demand shock reaches the divisions in one quarter and treasury in two. Robustness: $270m of cash above the floor today and $132m at the programme's low point. Resilience: Industrial Systems back in its band about three quarters after a $90m shock. (Vol I, Table 12.1)
- On the declared scale the cash wall reads 0.44, the covenant 0.32 and the strategic-risk ceiling 0.11, with the risk index 11 points under its limit of 75. The thinnest armor is the risk ceiling, and it is measured with an error of ±6. (Vol I, §12.4; WE 12.1 Step 1)
- Along the plan, armor falls from $270m to $132m at quarter 7. A phased build keeps it at $181m or more. (Vol I, WE 12.1 Step 2; OA 12.B.Ex.6)
- A closure of the funding window lands in the plan's seven thin quarters with a probability of about 16%, and after the low point armor is rebuilt only slowly, so the race must be won with armor. For regulatory interventions at 0.15 a year and seven quarters to recover, the race is 23%. (Vol I, WE 12.1 Step 4; §12.6)
- A $100m standby line cuts the breach chance to 12.4%, a phased build to 13.1%, and the two together to 3.0%. (Vol I, Table 12.6)
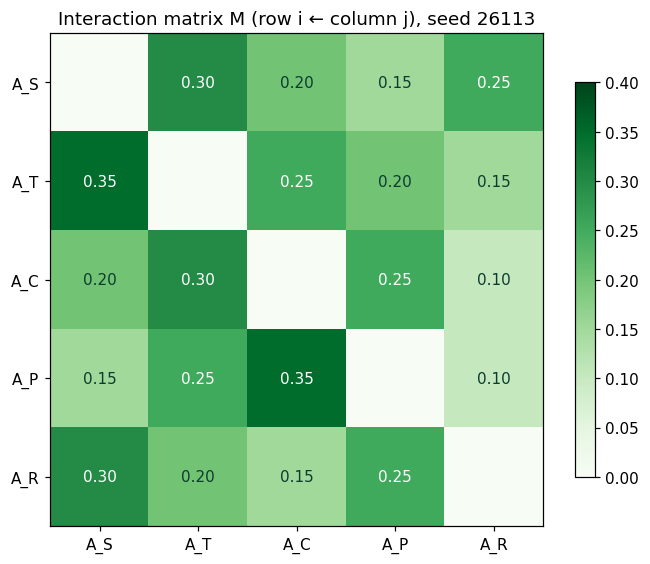
- With a gain of 0.40 on each arrow of the four-unit core, the spectral radius is 0.80 and the total multiplier is 5, against 1.8 in a register of direct exposures. (Vol I, Fig 12.2; OA 12.B.Ex.4)
Explore it
- Four questions, ten channels. The four questions of Vol I, Table 12.1, and the ten loss channels of Table 12.2 joined to the Meridian components that support them. Select a question for Meridian's reading, or a channel for its support and typical measure.
How it goes wrong
- One word, risk, is used for four questions, and the answer to one is read as the answer to another (Table 12.1).
- Value at risk is added across units, and consolidation appears to raise risk, or hides it (Thm 12.1).
- A likelihood-times-impact register multiplies independent odds for shocks that share a cause (Thm 12.5(iv)).
- Resilience is reported as one score, so a fast but shallow company and a slow but deep one look alike (Thm 12.3).
- Recovery speed is relied on where the next shock is likely to arrive first (Thm 12.4).
- A feedback core is treated as a list of direct exposures, and the echo is missed (Thm 12.5).
What a company must declare
- For each risk: its channel, the objective, floor or covenant it measures a shortfall against, and its support components.
- Its mode (distribution or set), its measure and the level at which it is read.
- For distributions, event rates and severities and the persistence and size of deviations; for sets, the declared disturbance bounds.
- The walls: each reading, its limit and the scale on which armor is measured.
- Resilience: the rate and margin of each mode, and any common causes shared between risks.
How AXIOM uses it
AXIOM computes the breach odds, value at risk and expected shortfall, the reverse stress test on the cash floor, armor along the plan and the multiplier of the risk core. The recovery clock, the race and the full channel register belong to AXIOM's architecture module (in development).
Best Practices
Practices from the Corporate Transformation Best Practices knowledgebase that bear on this architecture.
- Secure the cash runway before you need it, and measure liquidity at its worst point
Armor is read at the low point of the plan, not at today's balance; this practice measures it there.
- Finance and size big bets so the company survives a downturn in the first years
Sizing a bet against its worst early years is choosing the armor before the race begins.
- Plan on the downside: assume the legacy business declines faster and the cycle turns, and have the cost playbook ready
Planning on a declared stress set rather than on the expected path.
- Sequence customer-facing cutovers last, rehearse failure at full scale, and make resilience a programme outcome
Rehearsing recovery measures the rate of return; scheduling the riskiest step last protects the margin.
- Scale risk, quality and control functions with the speed and size of the change
The risk register and its owners must grow with the exposure the programme creates.
Cases
- Ford Motor Company: The Way Forward (2006) and the One Ford plan under Alan Mulally (2006–2011)
The knowledgebase cites this case as evidence for BP-044.
Further reading
Read it on the DCT MapIn the LexiconRisk appetite, in the LexiconRead the chapter: Vol I, Ch 12
UETAVol I, Chs 13–14UE
Unified Enterprise Transformation Architecture (UETA)
Do the five descriptions make one company?
What it is
The Unified Enterprise Transformation Architecture holds the five descriptions together (Vol I, Chs 13–14; Def 13.1). It rests on three principles: one shared skeleton, the state architecture; one state, so that every layer is a readout of the same trajectory (Def 13.2); and declared coupling, so that whatever passes between layers is written down.
The coupling register records each channel from one layer to another: the component, arrow or constraint it runs through, its functional form and its declaration (Def 13.1). Its gains make up an interaction matrix: the diagonal blocks are each layer's own gains, the off-diagonal blocks are the couplings, and a zero block is itself a declaration that someone must own (Def 13.5). Even an empty register is a claim, and a falsifiable one (Prop 13.1).
Five compatibility conditions make the five descriptions one company (Def 13.4): every carrier, support and write set is a component of the state architecture; an indicator shared by two layers has one measurement contract; every risk buffer names the capital stock that funds it, and that identity is in the register; the joint feasible region is not empty; and each move's domain is cut down to that region. Chapter 14 then asks whether the unified model is fit to optimize: whether it is stable, well conditioned and viable over the horizon.
The board questions it answers
- Do our five models describe one company?
- Are "fully funded" and "fully buffered" true together?
- When will each ledger feel this programme, and which ledgers can it never reach?
- Can every office pass its stress test while the company fails?
- Can we afford a new synergy link?
- What does deciding separately cost us?
What the book proves
- Thm 13.1 Unifying keeps every existing model and drops none: each layer survives unchanged, and none is redundant.
- Thm 13.3(ii) The whole needs the interaction matrix's spectral radius below one. Every layer passing its own test is necessary, never sufficient.
- Thm 13.3(iii) No route of positive gain means no effect: an insulation certificate exactly as strong as the register is honest.
- Thm 13.4(iii) Confinement: no ledger responds before its distance from the programme's write set.
- Thm 13.5 Consistency is necessary, cycles defeat bilateral checks, and every funded company has a cycle running through capital, performance and risk.
- Prop 13.5 Integrated decisions beat separated ones by exactly what the couplings carry.
- Thm 14.3 The register is a stability budget: its ceilings bound the true dynamics, and a single new link can break the budget.
Meridian, the book’s worked company
Vol I runs Meridian's programme through all five ledgers at once.
- Three ledgers, three clocks: liquidity bottoms at $482m at month 21 against the $350m floor; the scorecard bottoms at 32.1 at month 11 and is back at 37.0 at month 29; strategic risk peaks at 73.55 at month 11 against its ceiling of 75. A review at month 11 sees failure in one ledger and comfort in another. (Vol I, Fig 13.1; OA 13.B.Ex.4)
- Confinement: the programme writes to Digital and engineering; treasury and Industrial Systems are one step away; Materials, the market and governance are unreachable, so crediting Materials with the programme is refuted by the wiring. (Vol I, Thm 13.4(iii); OA 13.B.Ex.3)
- The joint check: the programme's draw of $138m at quarter 7 and the closure buffer of $187m are both claims on the same $270m of cash above the floor. Together they come to 325, short by $55m, although each office signed off its own claim. The standby line and the phased build together pass by $94m; alone, the line leaves 12.4% breach odds and phasing 13.1%; only both reach 3.0%. (Vol I, WE 13.1; Table 13.6)
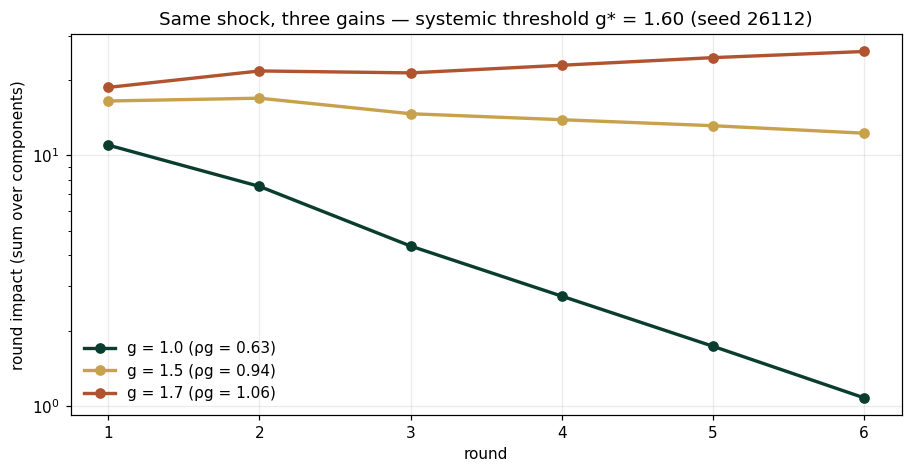
- The risk core: a gain of 0.40 on each of its arrows gives ρ = 0.80, a half-life of 3.11 quarters and an amplification of 5. A new link between Industrial Systems and Digital at 0.40 lifts ρ to 1.0246, so a synergy every office would approve makes the core unstable. The board's rule of a half-life of at most four quarters caps ρ at 0.8409. (Vol I, WE 14.1; OA 14.B.Prop.1)
- The register's channels are named block by block; Vol I prints numeric gains only for the risk core. (Vol I, Table 13.2)
Explore it
- The coupling register. The channels of Vol I, Table 13.2, as Meridian instantiates them, from the layer they leave to the layer they enter, with the risk core as the one block whose gains the book prints. Select a channel for its form, what it runs through and the book's values.
- Add the new link. Meridian's risk core with a gain of 0.40 on each arrow (Vol I, Fig 12.2; WE 14.1). Add the proposed link between Industrial Systems and Digital and the spectral radius, computed here from the gain matrix, moves from 0.80 to 1.0246.
How it goes wrong
- Every layer passes its own stress test while the whole is unstable (Thm 13.3(ii); Fig 13.2).
- The same cash is promised to two purposes (WE 13.1).
- A single synergy, one every office would approve, pushes the company past its stability edge (WE 14.1).
- A blank in the register is read as "no coupling" rather than as a claim nobody made (Prop 13.1).
- A risk buffer is declared without the capital stock that funds it (Def 13.4, C3).
What a company must declare
- Each channel: the layer it leaves and the layer it enters, what it runs through in the state architecture, its form (identity, inequality, linear gain or domain restriction) and, where it is linear, its gain, sign and lag; its owner and source.
- For each of the twenty off-diagonal blocks: declared zero, with its owner and reason, or the channels it carries.
- The gains of the risk core.
- Owners for the analytical assumptions of Table 14.1.
How AXIOM uses it
AXIOM computes the stability of the risk core (ρ, half-life, amplification and the repairs that meet the board's half-life rule), audits measured gains against the register's ceilings, and checks the joint feasibility of the cash commitments, the test of WE 13.1. The full coupling register, the five compatibility conditions and the ledger clocks belong to AXIOM's architecture module (in development).
Best Practices
Practices from the Corporate Transformation Best Practices knowledgebase that bear on this architecture.
- Transform from strength, with a protected multi-year funding envelope or self-funding productivity
A protected envelope is a funding coupling declared in advance, so the programme's draw and the buffers do not claim the same cash.
- Budget the whole-life cost of a core programme, treat budget rises as new decisions, and retire legacy on a dated plan
Each budget rise changes a cross-ledger claim; treating it as a new decision re-runs the joint check.
- State one short plan, repeat it, and run it through one small forum on a fixed cadence
One forum is where the joint check happens: the place each office's sign-off is read against the others.
- Run the old and new models side by side, funded by the old, and tell investors which numbers will replace the old ones
Funding the new from the old is a coupling between ledgers that has to be stated, together with the trough it creates.
- Recognise restructuring and integration costs early, in full, and separately from the savings
Costs and savings land in different ledgers on different clocks; booking them apart keeps each ledger honest.
Cases
- Ping An Insurance (Group) Company of China: Technology-led transformation: 'finance + technology' and 'finance + ecosystem' (2013 onward)
The knowledgebase cites this case as evidence for BP-063.
Further reading
Read it on the DCT MapIn the LexiconCoupling register, in the LexiconRead the chapter: Vol I, Chs 13–14
GEOPVol I, Ch 15
GEOP and the Enterprise Optimization Architecture (GEOP)
What is the best plan the architectures allow?
What it is
The General Enterprise Optimization Problem is the decision the architectures exist to support (Vol I, Ch 15; Def 15.1). It has six declarations, each with an owner: the horizon; the decisions and the set each may take; the policy class, from a fixed plan to full feedback; the environment, given as a reference, a model of chance or a set; the objective; and the commitments the answer must keep.
Each architecture supplies part of it (Table 1.4; Table 15.1). The state architecture supplies the admissible states, the scopes of the commitments and the structure of the dynamics. The transformation architecture supplies the decisions and their domains. The capital architecture supplies the laws of the stocks, the capital floors and the prices of stocks. The performance architecture supplies the objective, the targets and the frontier. The risk architecture supplies the risk limits and the stress sets. The coupling register supplies the buffer identities and funding couplings, and the unified view supplies the feasible region and the stability certificate.
The Enterprise Optimization Architecture is the estate that hosts these problems, in four layers (Def 15.9). The model layer holds the unified declaration and its data; the formulation layer holds the problem instances and their audits; the solver layer holds methods with the certificates they can return (Table 15.4); the governance layer says who may formulate, solve, approve and implement. A number without a certificate does not travel. Machine learning enters only at three declared points, and never replaces the statement of the problem.
The board questions it answers
- What is the cheapest plan that keeps every commitment, and what does each commitment cost?
- Is the plan feasible before it is called optimal, and can it be held?
- What does running the company as silos cost?
- Who formulated this number, who solved it, who approved it, and what does its certificate say?
- Can the number be reproduced?
- Where did machine learning touch it?
What the book proves
- Prop 15.4 Feasibility precedes optimality: the audit runs in a fixed order, consistency, then viability, then optimization.
- Thm 15.3 At the optimum the plan is held only by what binds, and each binding commitment carries a price; a slack commitment's price is zero.
- Thm 15.5 With several objectives, best means Pareto-best, and the frontier's slope is the exchange rate between them.
- Thm 15.6 Where the register is silent, decentralization is exact; where it is not, prices on the coupling commitments coordinate the offices; dividing shared resources by fixed shares never does better; and appending the stability certificate gives the holdable optimum.
- Prop 15.7 A certainty-equivalent, a robust and a stochastic formulation make different promises, and the board should know which one it is buying.
Meridian, the book’s worked company
Vol I solves Meridian's funding decision as a GEOP in Worked Example 15.1.
- The decisions are a standby line, owned by the CFO, and a delay to the build, owned by the transformation office; the objective is the line's fees plus the cost of delay; the commitment is a chance of at most 5% of breaching the $350m floor in any quarter. (Vol I, WE 15.1)
- The certainty-equivalent formulation buys nothing, because the mean path's trough is $460m, while the true chance of breach is 24.6%. (Vol I, WE 15.1; Prop 15.7)
- At 5% the optimum is a $170m line and a delay of 0.668 quarters, costing $10.44m. The appetite's price is $1.81m per point of breach probability, an implied value of about $180m on a breach. (Vol I, OA 15.B.Ex.4)
- Silos: the line alone cannot get below 8.4% at any size, and phasing alone costs $40.76m; coordinating the two saves $30.3m. The earlier package of line and phasing costs $19.0m at 3.0%, against $14.7m on the frontier. (Vol I, OA 15.B.Ex.4)
- The book gives no EOA table for Meridian; the example fills its four layers implicitly: the model (the Ch 8 paths), the formulation with its owners, the solver (the exact quantile on 100,000 paths) and the governance (the board owns the appetite). (Vol I, WE 15.1)
Explore it
- What each architecture supplies. Each architecture feeding the parts of the decision problem (Vol I, Table 1.4; Table 15.1), and the four layers of the Enterprise Optimization Architecture that host it (Def 15.9). Select a node to read what it supplies and what the book proves about it.
How it goes wrong
- The problem is optimized before it is checked for feasibility (Prop 15.4).
- A paper optimum is adopted that the company cannot hold (Thm 15.6(iv)).
- One readout silently plays two roles, objective and commitment (Table 15.3).
- Offices optimize separately and pay for the coordination they skipped (Thm 15.6(iii)).
- An uncertified number travels into a board paper (Def 15.9).
- A learned model is allowed to stand in for the problem statement (Def 15.9).
What a company must declare
- The six declarations of Def 15.1, each with its owner.
- Every commitment by class (Table 15.2): its owner, level and whether it binds.
- The certificate each result carries: method, grade, tolerance, audit status and the seeds that reproduce it.
- Governance: who may formulate, solve, approve and implement, and above what spending threshold approval is needed.
How AXIOM uses it
AXIOM computes the appetite package of WE 15.1, with its frontier and the price of each binding commitment, checks Optimization Readiness R1–R4 before it optimizes, and records each result's method, certificate and approval. The full nine-class commitment table and the EOA view belong to AXIOM's architecture module (in development).
Best Practices
Practices from the Corporate Transformation Best Practices knowledgebase that bear on this architecture.
- Treat vendor attestations, awards and executive testimony as claims to test, not as assurance
The EOA's rule that uncertified numbers do not travel, applied to every claim that reaches the board.
- Build independent challenge into the board for transformational bets
The governance layer separates who formulates from who approves.
- Write exit and pause criteria at approval, and treat impairments as triggers to re-test the strategy
Declaring the commitments, and what breaks them, before solving.
- Set a walk-away price from stand-alone value plus provable synergies, and re-test the deal when it changes
A walk-away price is a declared commitment; re-testing it is re-solving when the declaration changes.
- Diagnose the root cause and the gap to the best before choosing the remedy
Formulating the problem before optimizing it: consistency and feasibility come first.
Cases
- Lidl (Lidl Stiftung & Co. KG, Schwarz Group): eLWIS merchandise-management system on SAP for Retail / HANA
The knowledgebase cites this case as evidence for BP-019.
Further reading
Read it on the DCT MapIn the LexiconRobust optimization, in the LexiconRead the chapter: Vol I, Ch 15
Where to go next
- The DCT Map
The seven moves, and where each architecture enters.
- DCT Governing Dynamics
The mathematical elements that compute on these objects.
- AXIOM Laboratory
Every chapter, the architecture chapters included, instrumented by AXIOM modules.